The previous post covered images and figure — how to insert an image, add a caption, get automatic numbering, and reference it from the body text. This post moves on to another content element you’ll reach for constantly: tables.
This post starts with the basic syntax of the table function, looking at how columns and headers are set up; then covers cell styling — alignment, spacing, fill, and stroke; then moves on to the three-line table so common in academic writing, building a clean layout with hline and covering caption position and notes along the way; and finishes with how to merge cells.
Table Basics
Typst uses the table function to draw tables. This section starts with the basic syntax.
The table Function and Basic Syntax
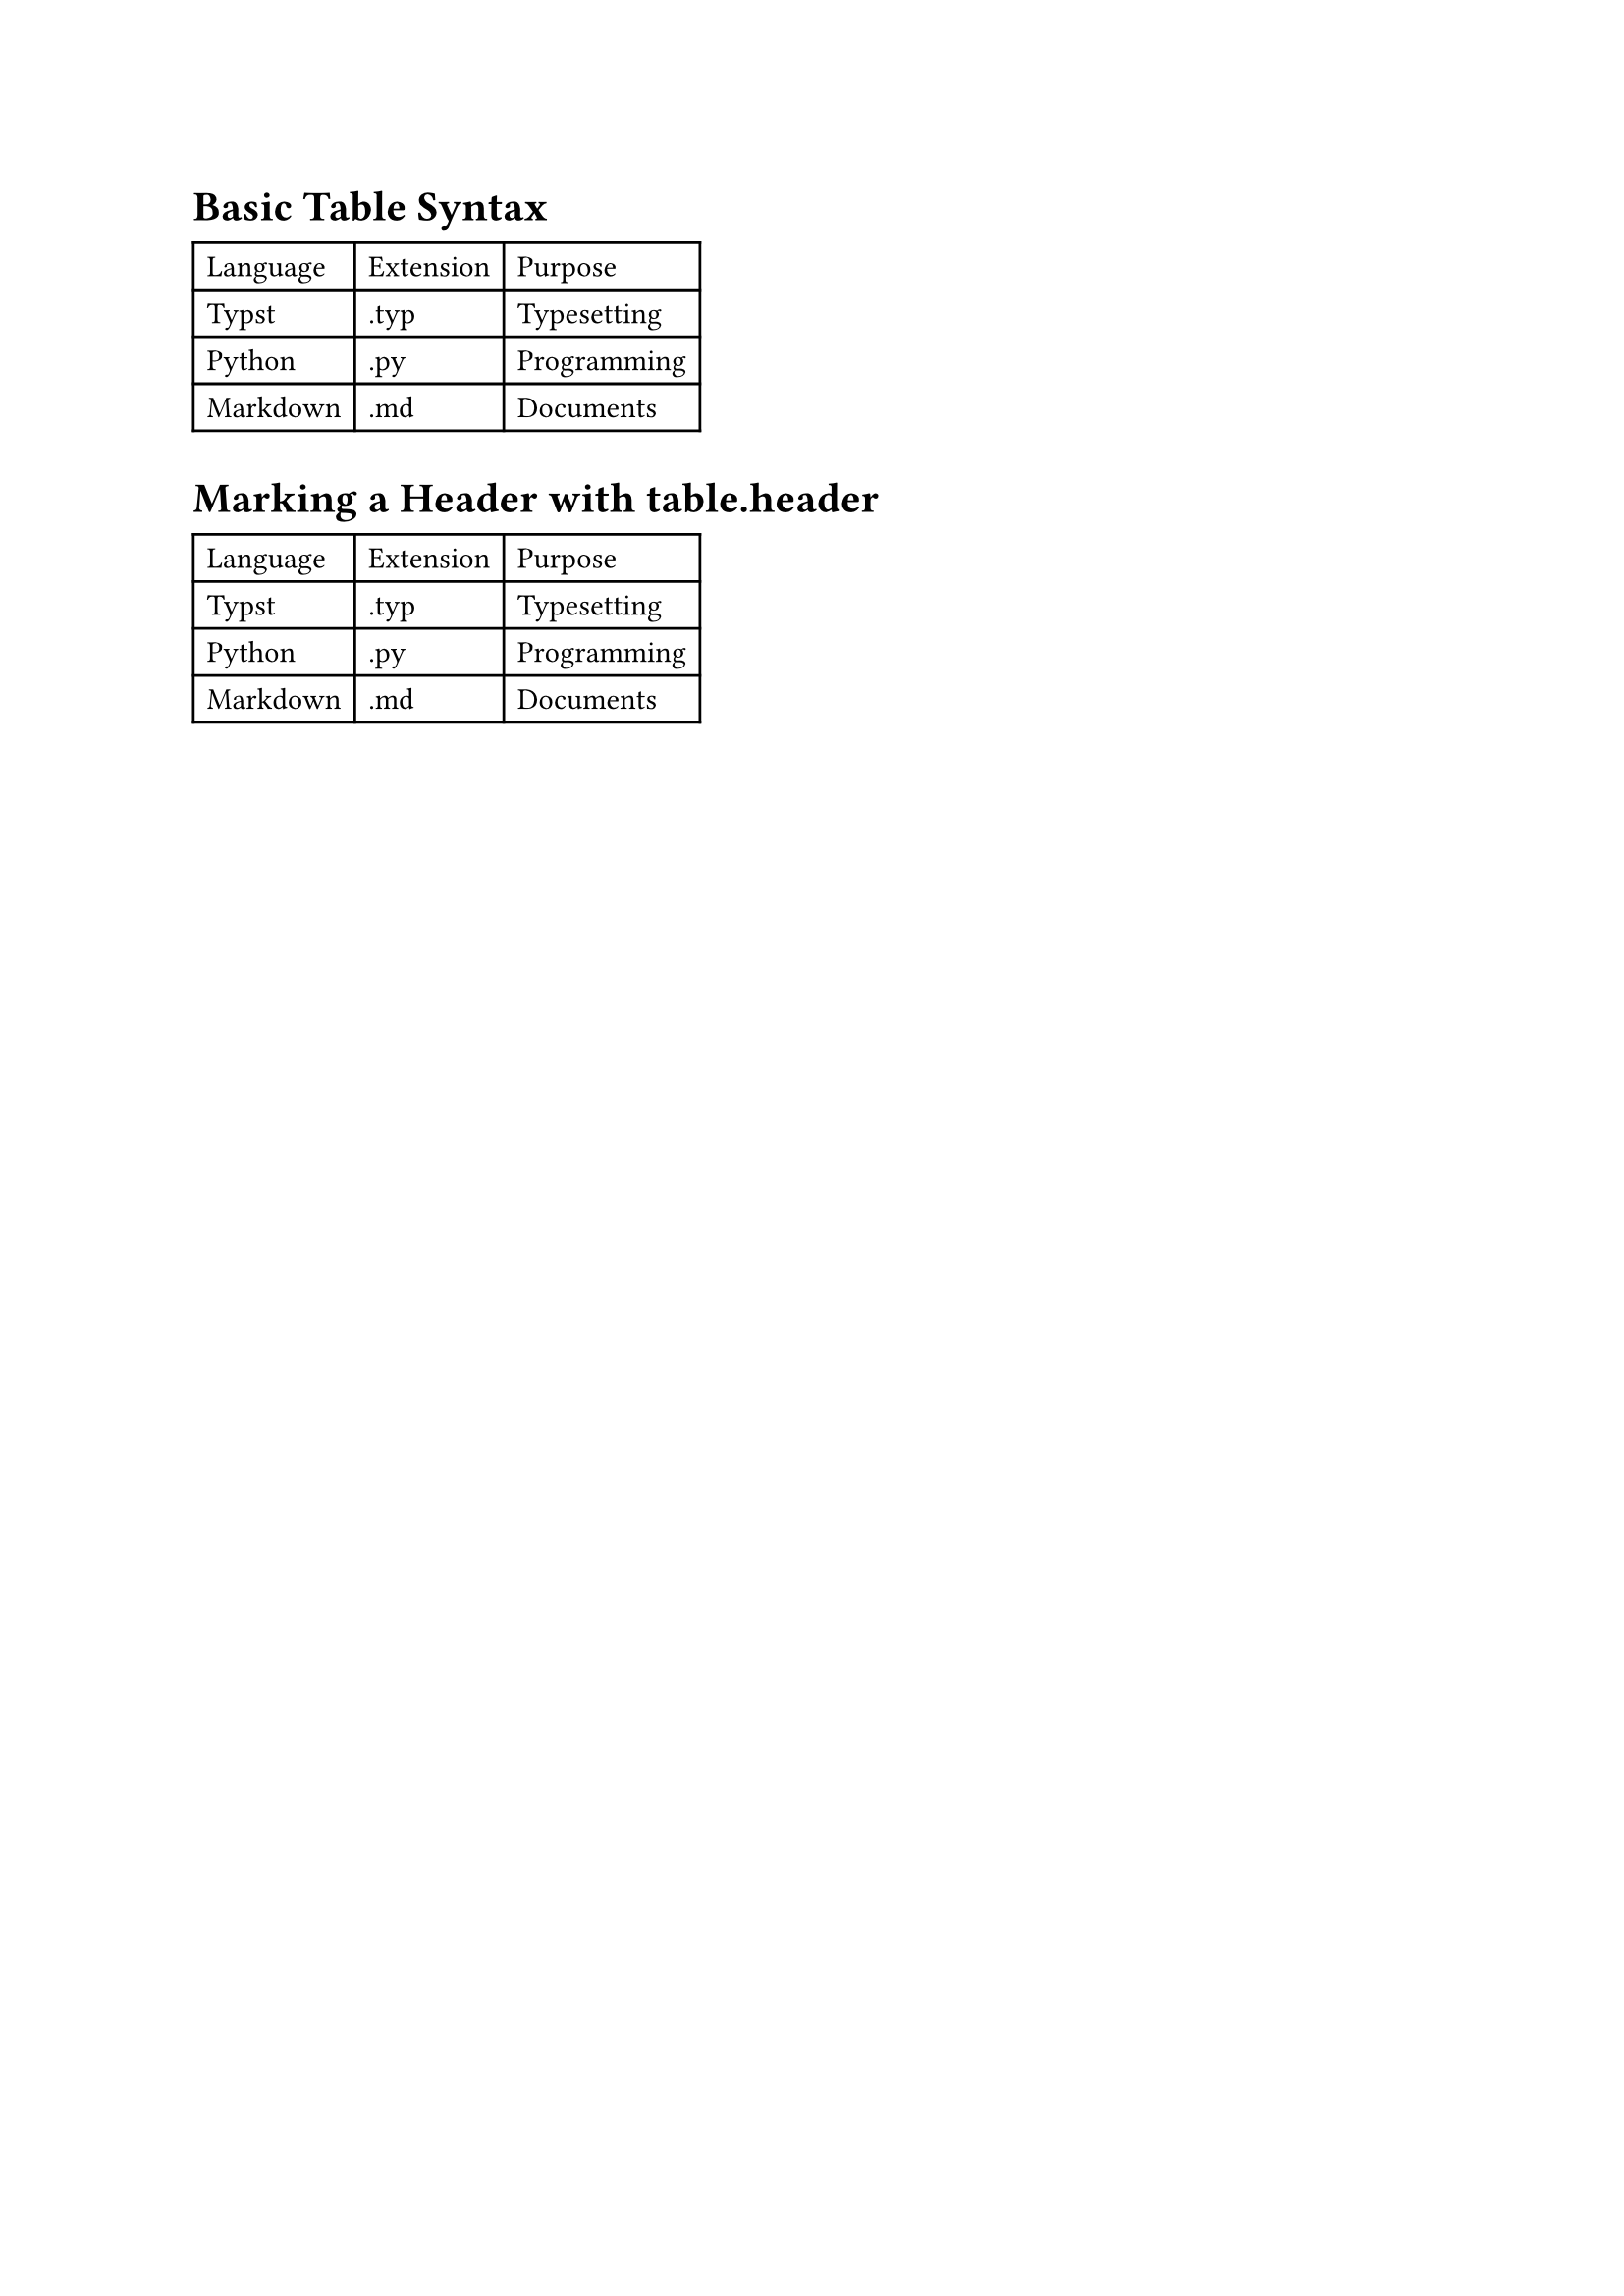
A table‘s content is a flat sequence of cells, laid out left to right and top to bottom to fill the given number of columns — quite similar to LaTeX’s tabular:
1 | #table( |
columns: 3 means every 3 cells start a new row. This example has 9 cells total, laying out a 3-column, 3-row table whose first row is the header.
Columns and Headers
Besides a plain number, columns also accepts an array of lengths or ratios to control each column’s width — for example columns: (1fr, 2fr, 1fr) makes the middle column twice as wide.
Common width units are listed below:
| Unit | Description |
|---|---|
auto |
Sized automatically to fit the content (default) |
1fr |
Distributes remaining space proportionally1 |
3cm, 50pt |
Fixed length |
30% |
A percentage of the page’s available width |
A table’s first row is often a header. Writing it as the first cells in the list works, but it’s better to mark it explicitly with table.header(...):
1 | #table( |
Both approaches look identical by default. The difference is that once marked with table.header, the header row automatically repeats at the top of the next page when a table spans multiple pages — no need to copy it manually — and it makes clear, semantically, that this row is a header.
A Worked Example
Cell Styling
table has quite a few style parameters you can adjust. This section covers alignment, spacing, fill, and stroke, and the scope each adjustment applies to.
Alignment and Spacing
The common style parameters are align (text alignment), inset (cell padding, which indirectly affects row height), and rows (sets row heights directly, used the same way as columns). Adjustments can be scoped at three levels, from broadest to narrowest:
The whole document: use #set table(...), and every #table after that point picks up this default, so you don’t have to repeat it for every table:
1 | #set table(inset: 10pt, align: center) |
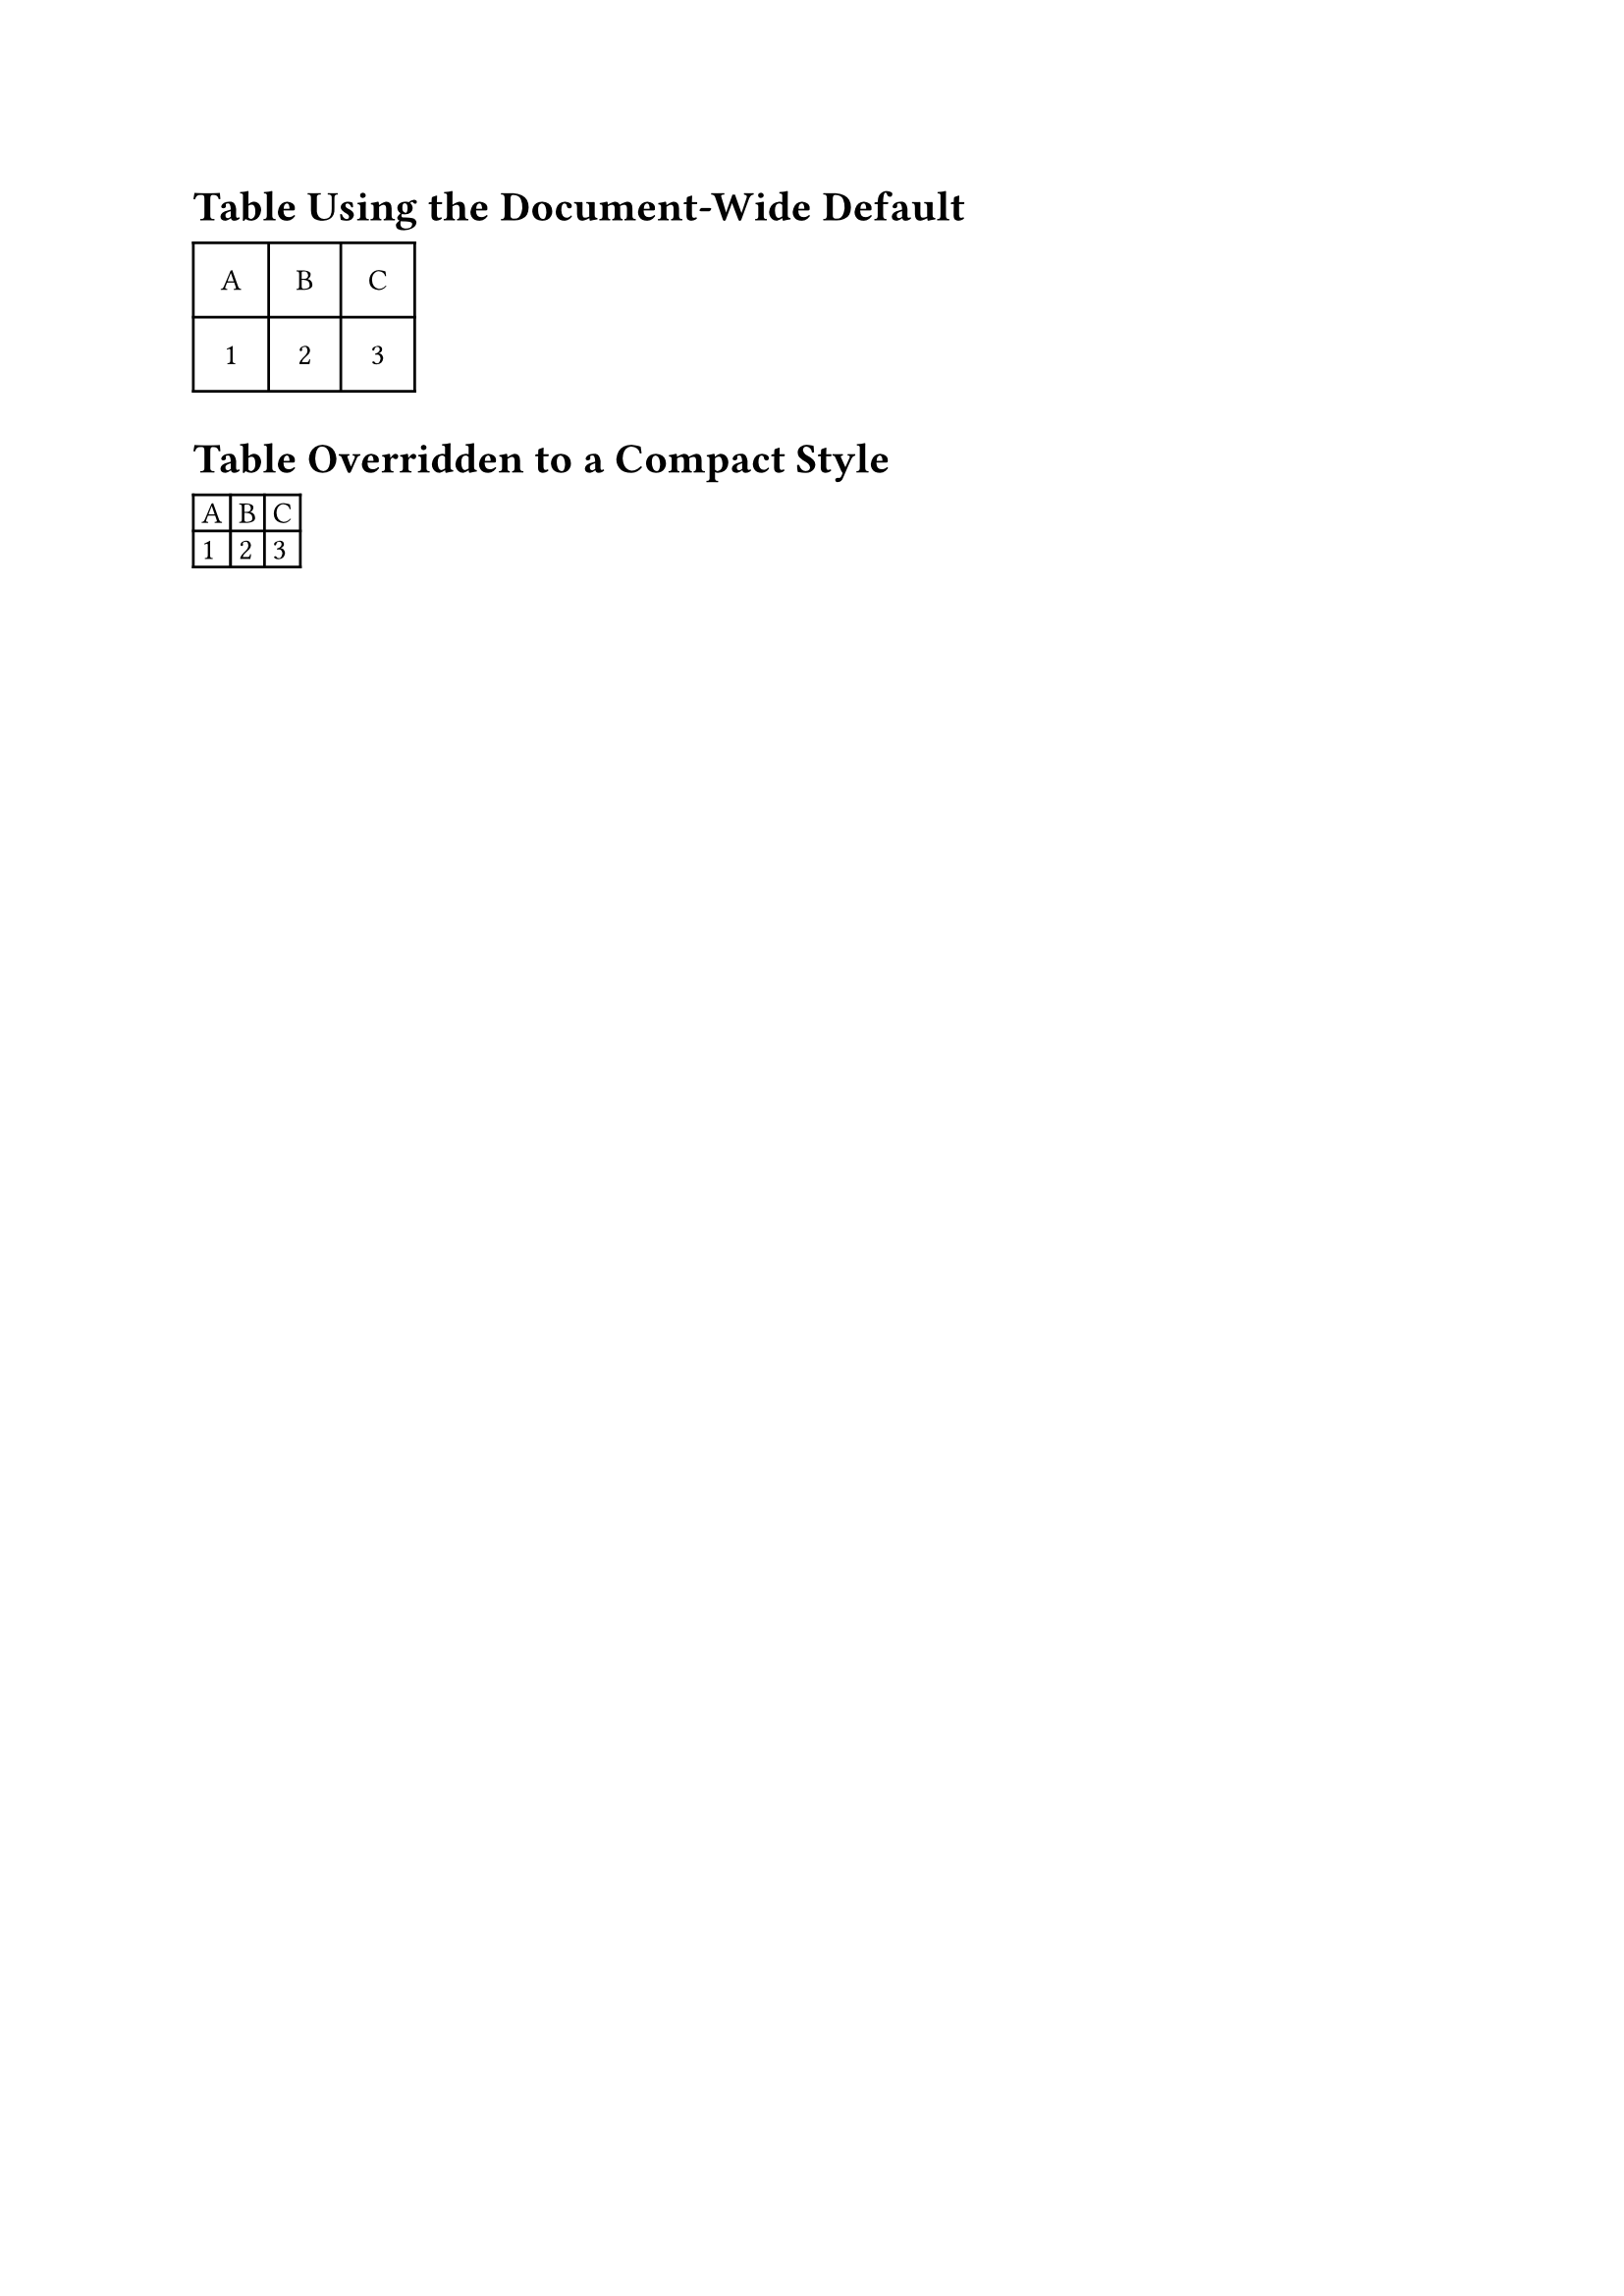
This line sets 10pt of cell padding and centered content for every #table from here on, so you don’t need to repeat these two parameters each time you call #table.
A single table: pass parameters directly to one #table(...) call, overriding only that table without affecting the others:
1 | #table( |
Seeing these two together makes the effect clearest: the document-wide default is loose and centered, and this particular table overrides inset and align to become compact and left-aligned — the same logic as stacking multiple #set rules back on Day 7:
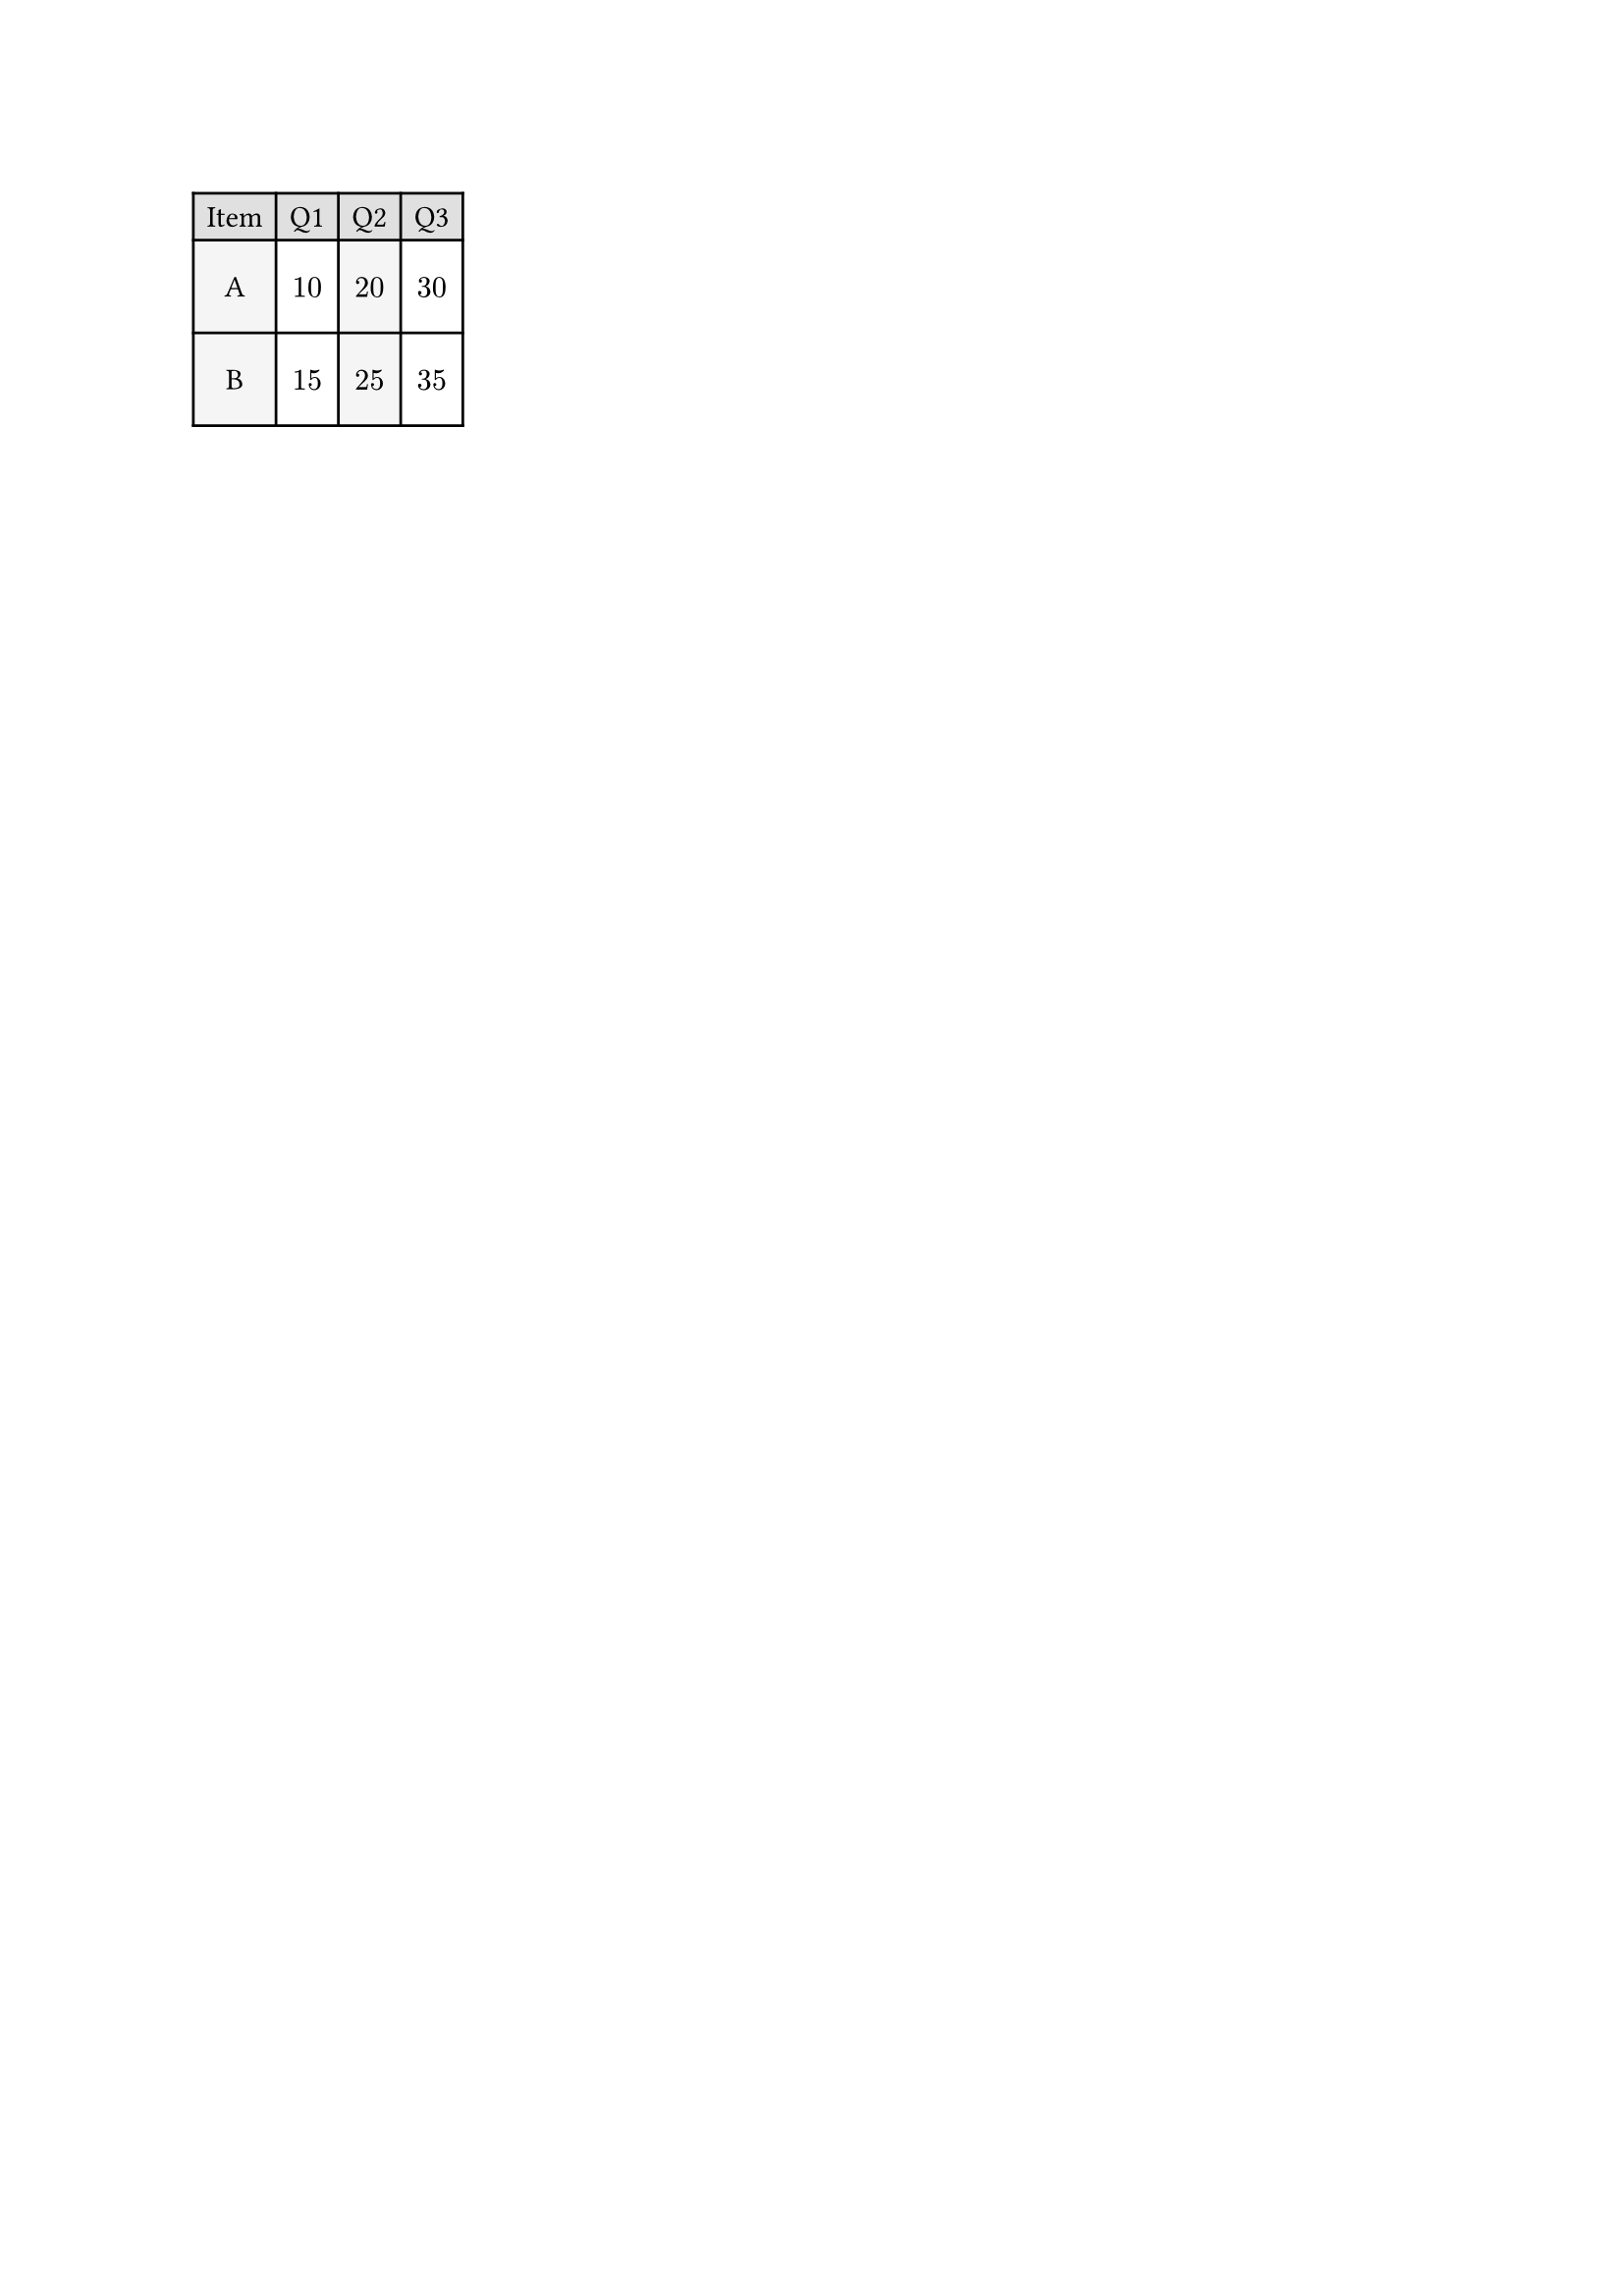
Specific cells: parameters like align and fill can also take a function (x, y) => ..., where x is the column index and y is the row index, returning a different value based on position — the most common use is alternating row colors:
1 | #table( |
y == 0 checks whether it’s the header row, and calc.even(x) checks whether the column index is even — these two conditions together decide the fill color. align: center + horizon centers every cell’s content both horizontally and vertically:
Fill and Stroke
Fill was already covered above, so this section looks at stroke for borders. Just like fill, stroke also accepts an (x, y) => ... function, except the return value is a dictionary specifying the top, bottom, left, and right sides individually:
1 | #table( |
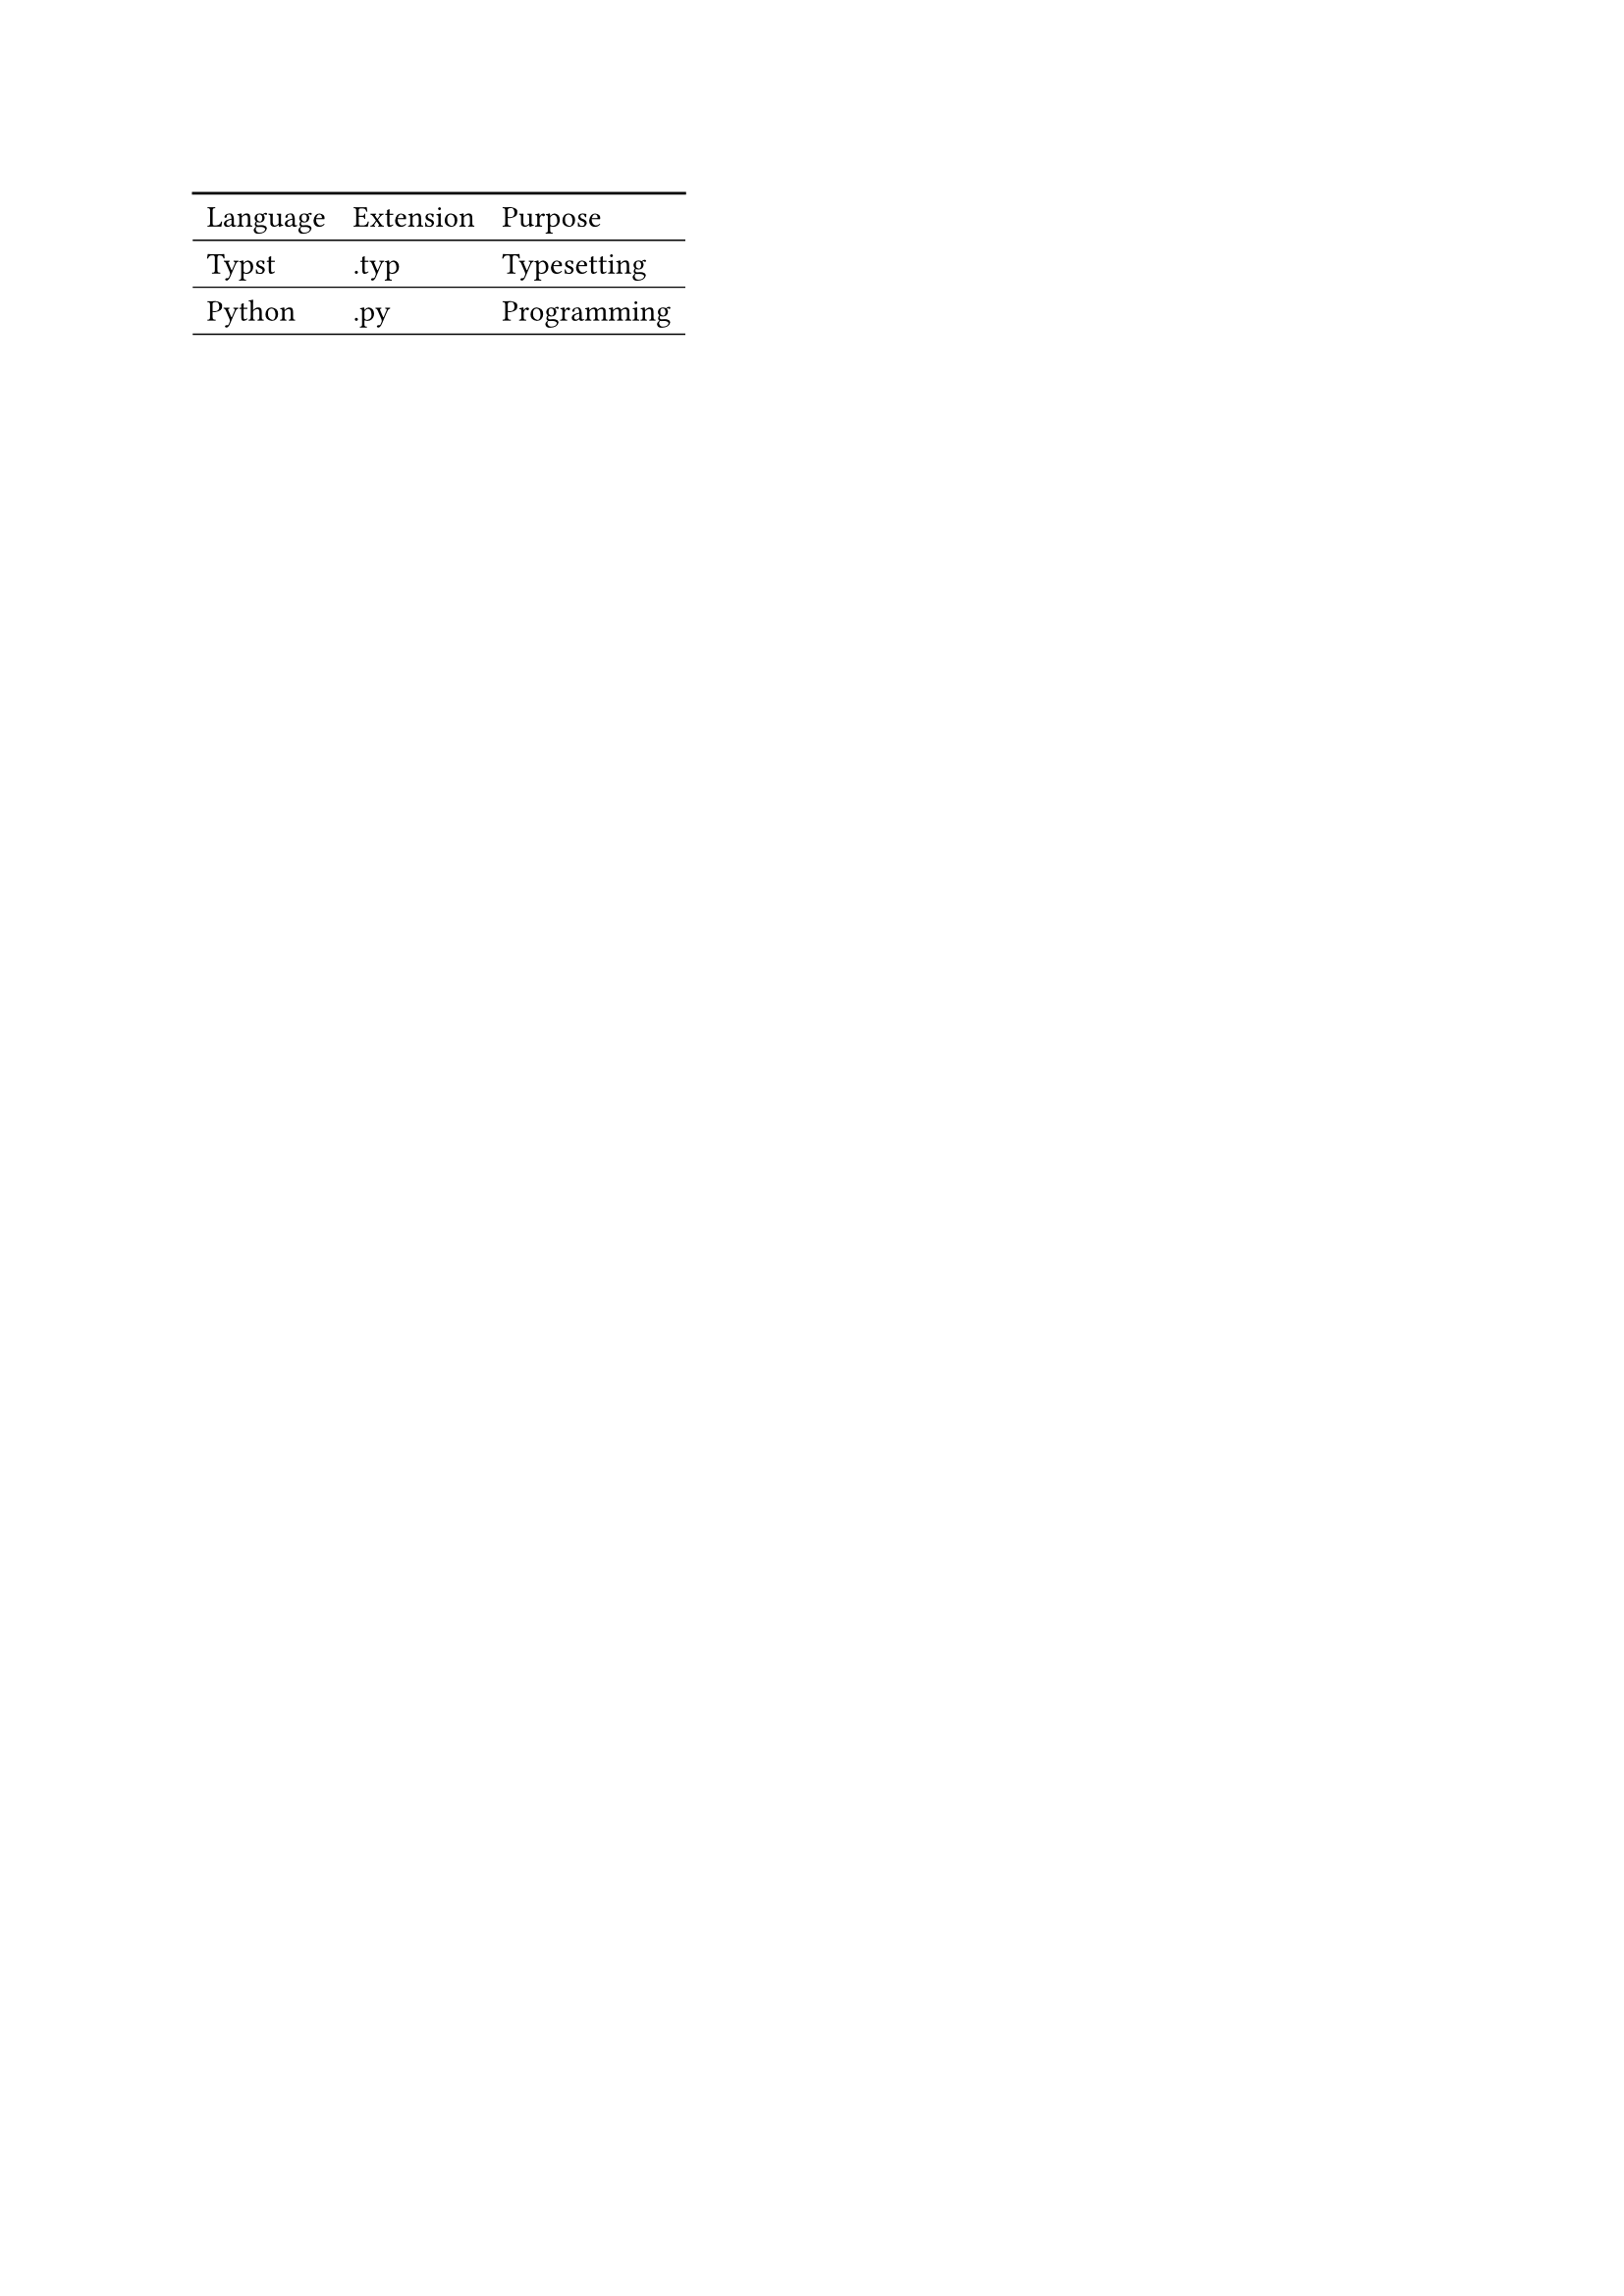
This dictionary only sets top and bottom — with left and right left out, there’s no vertical border at all, leaving only horizontal lines. That’s already very close to the three-line table the next section covers.
A Worked Example
Three-Line Tables
That table with nothing but horizontal lines from the last section is already very close to the three-line table style common in academic papers: only a top rule, a rule under the header, and a bottom rule, with no vertical rules at all.
The three-line table traces back to Edward Tufte’s data-ink concept from 1983: every bit of ink in a table should be used to represent data, and anything else should be cut. In 2003, Simon Fear built that philosophy into LaTeX’s booktabs package, explicitly arguing you should never use vertical rules, and never use double rules. That style went on to become the standard for international academic journal typesetting2.
Building a Three-Line Table with hline
A three-line table turns off all default borders and adds lines manually at specific positions with table.hline:
1 | #table( |
stroke: none first turns off all the table’s built-in borders, then three table.hline calls are inserted manually: the top and bottom rules use a heavier 1pt, and the rule under the header uses a lighter 0.5pt. That contrast in weight is the convention for a three-line table, and it’s the most obvious difference from an ordinary table.
Typst’s own package registry also has a ready-made booktabs package that wraps this whole manual setup into functions like toprule, midrule, and bottomrule you can call directly, instead of hand-rolling it every time. Installing and using packages is left for a dedicated post on packages later in the series — for now, just know the option exists.
Caption Position and Notes
Table captions are conventionally placed above the table, the opposite of the default for images, which needs a separate show rule:
1 | #show figure.where(kind: table): set figure.caption(position: top) |
figure.where(kind: table) only selects figures whose content is a table, so it doesn’t affect where image captions land.
Academic tables often need a note below them, such as an explanation of significance asterisks. Typing * directly in the content gets treated by Typst as a bold marker, so it needs to be escaped with a backslash as \* to display as a literal asterisk. Statistical symbols like p are conventionally written in math mode as , which automatically italicizes:
1 | #figure( |
A note can’t just be written outside the figure — that turns it into its own separate paragraph, with too much whitespace between it and the table, so it reads as disconnected. Wrapping the table and the note together into one piece of content with stack, then placing that whole thing inside figure, keeps the note glued right under the bottom rule.
A Worked Example
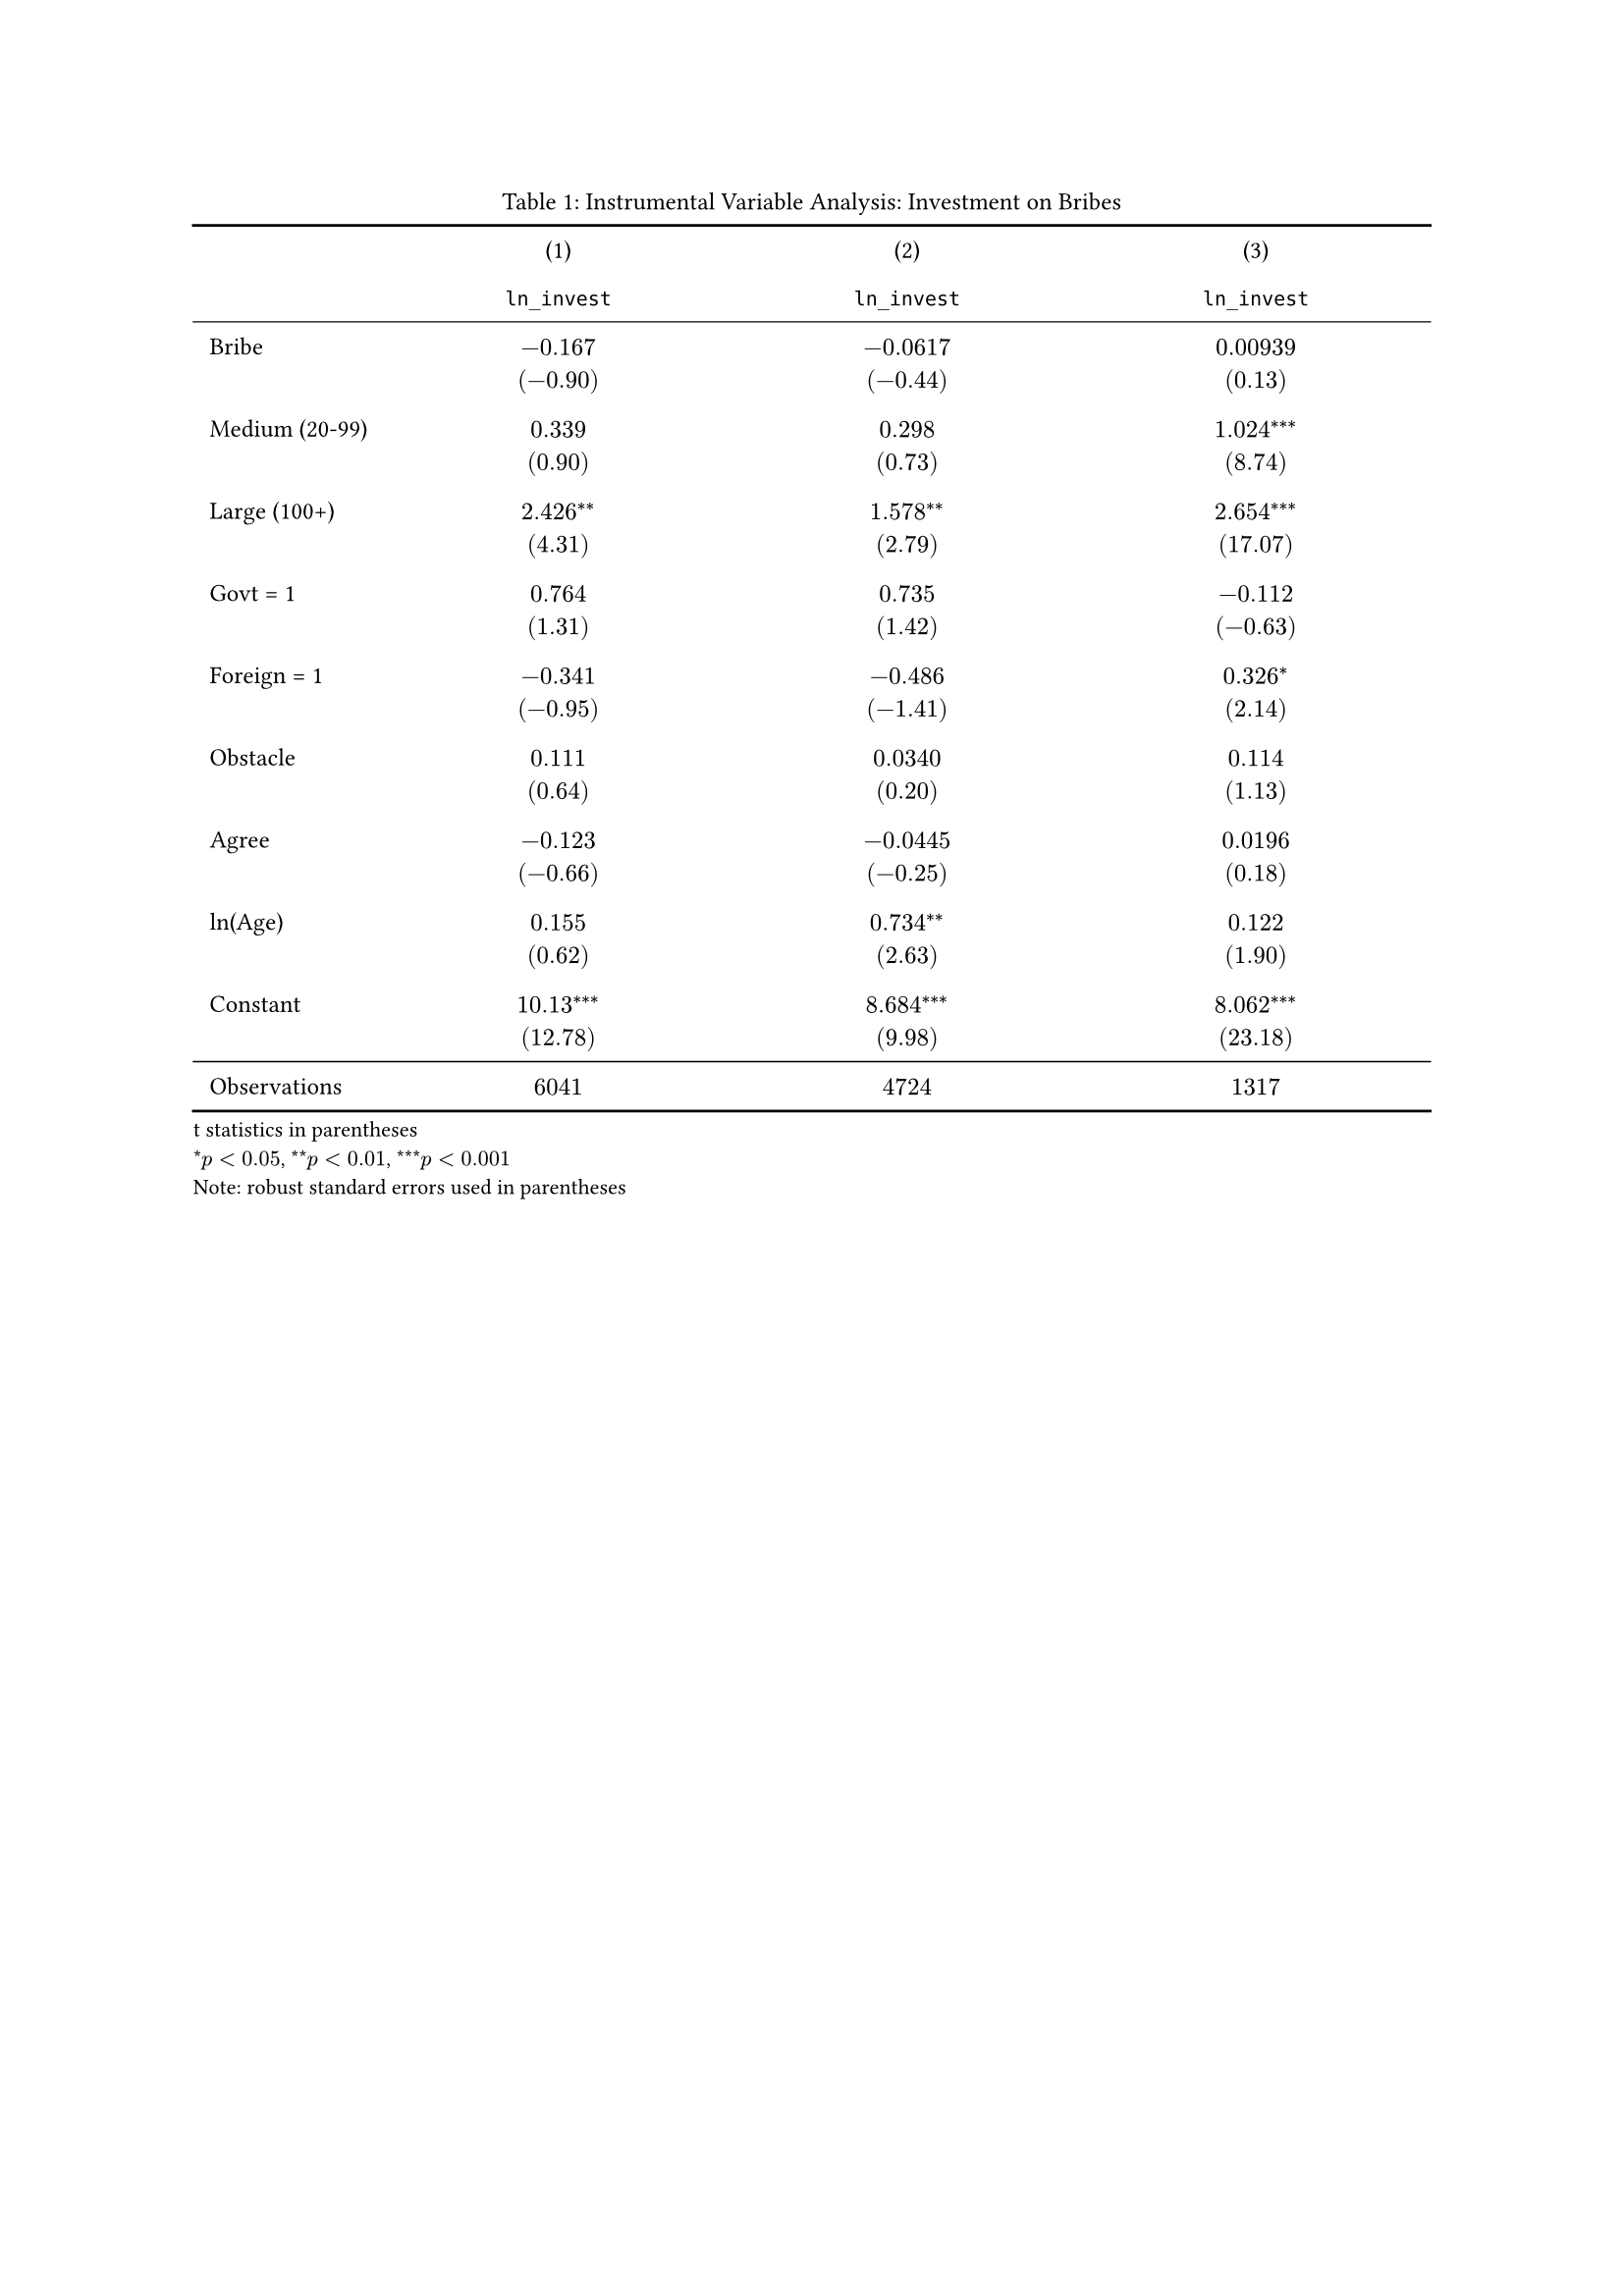
Real three-line tables in papers are usually much more elaborate — regression tables, for instance, commonly have a coefficient + test statistic two-line cell, which a \ line break inside a single cell handles easily. Numbers in the table are also consistently wrapped in math mode , and significance stars use a grouped superscript like ^(**) rather than bare asterisks, to avoid any confusion with multiplication; variable names (like `ln_invest` ) are conventionally set in monospace, which just falls out of wrapping them in backticks as raw text. This example is adapted from a LaTeX regression-table layout discussion3:
Merging Cells
Sometimes a table needs one cell to span multiple columns or rows — a multi-level header, for instance. This section looks at how table.cell handles that.
Merging Columns
Swap a cell for table.cell(colspan: n)[...], and it occupies n columns horizontally:
1 | #table( |
One thing to watch for: a merged cell automatically consumes the next n column slots, so you should not add empty placeholder cells afterward — doing so throws off the whole table’s layout.
Merging Rows
The usage mirrors colspan — swap in rowspan and a cell occupies multiple rows downward:
1 | table.cell(rowspan: 2)[Region] |
Same idea: the next row doesn’t need a placeholder for that column either — rowspan handles it automatically.
A Worked Example
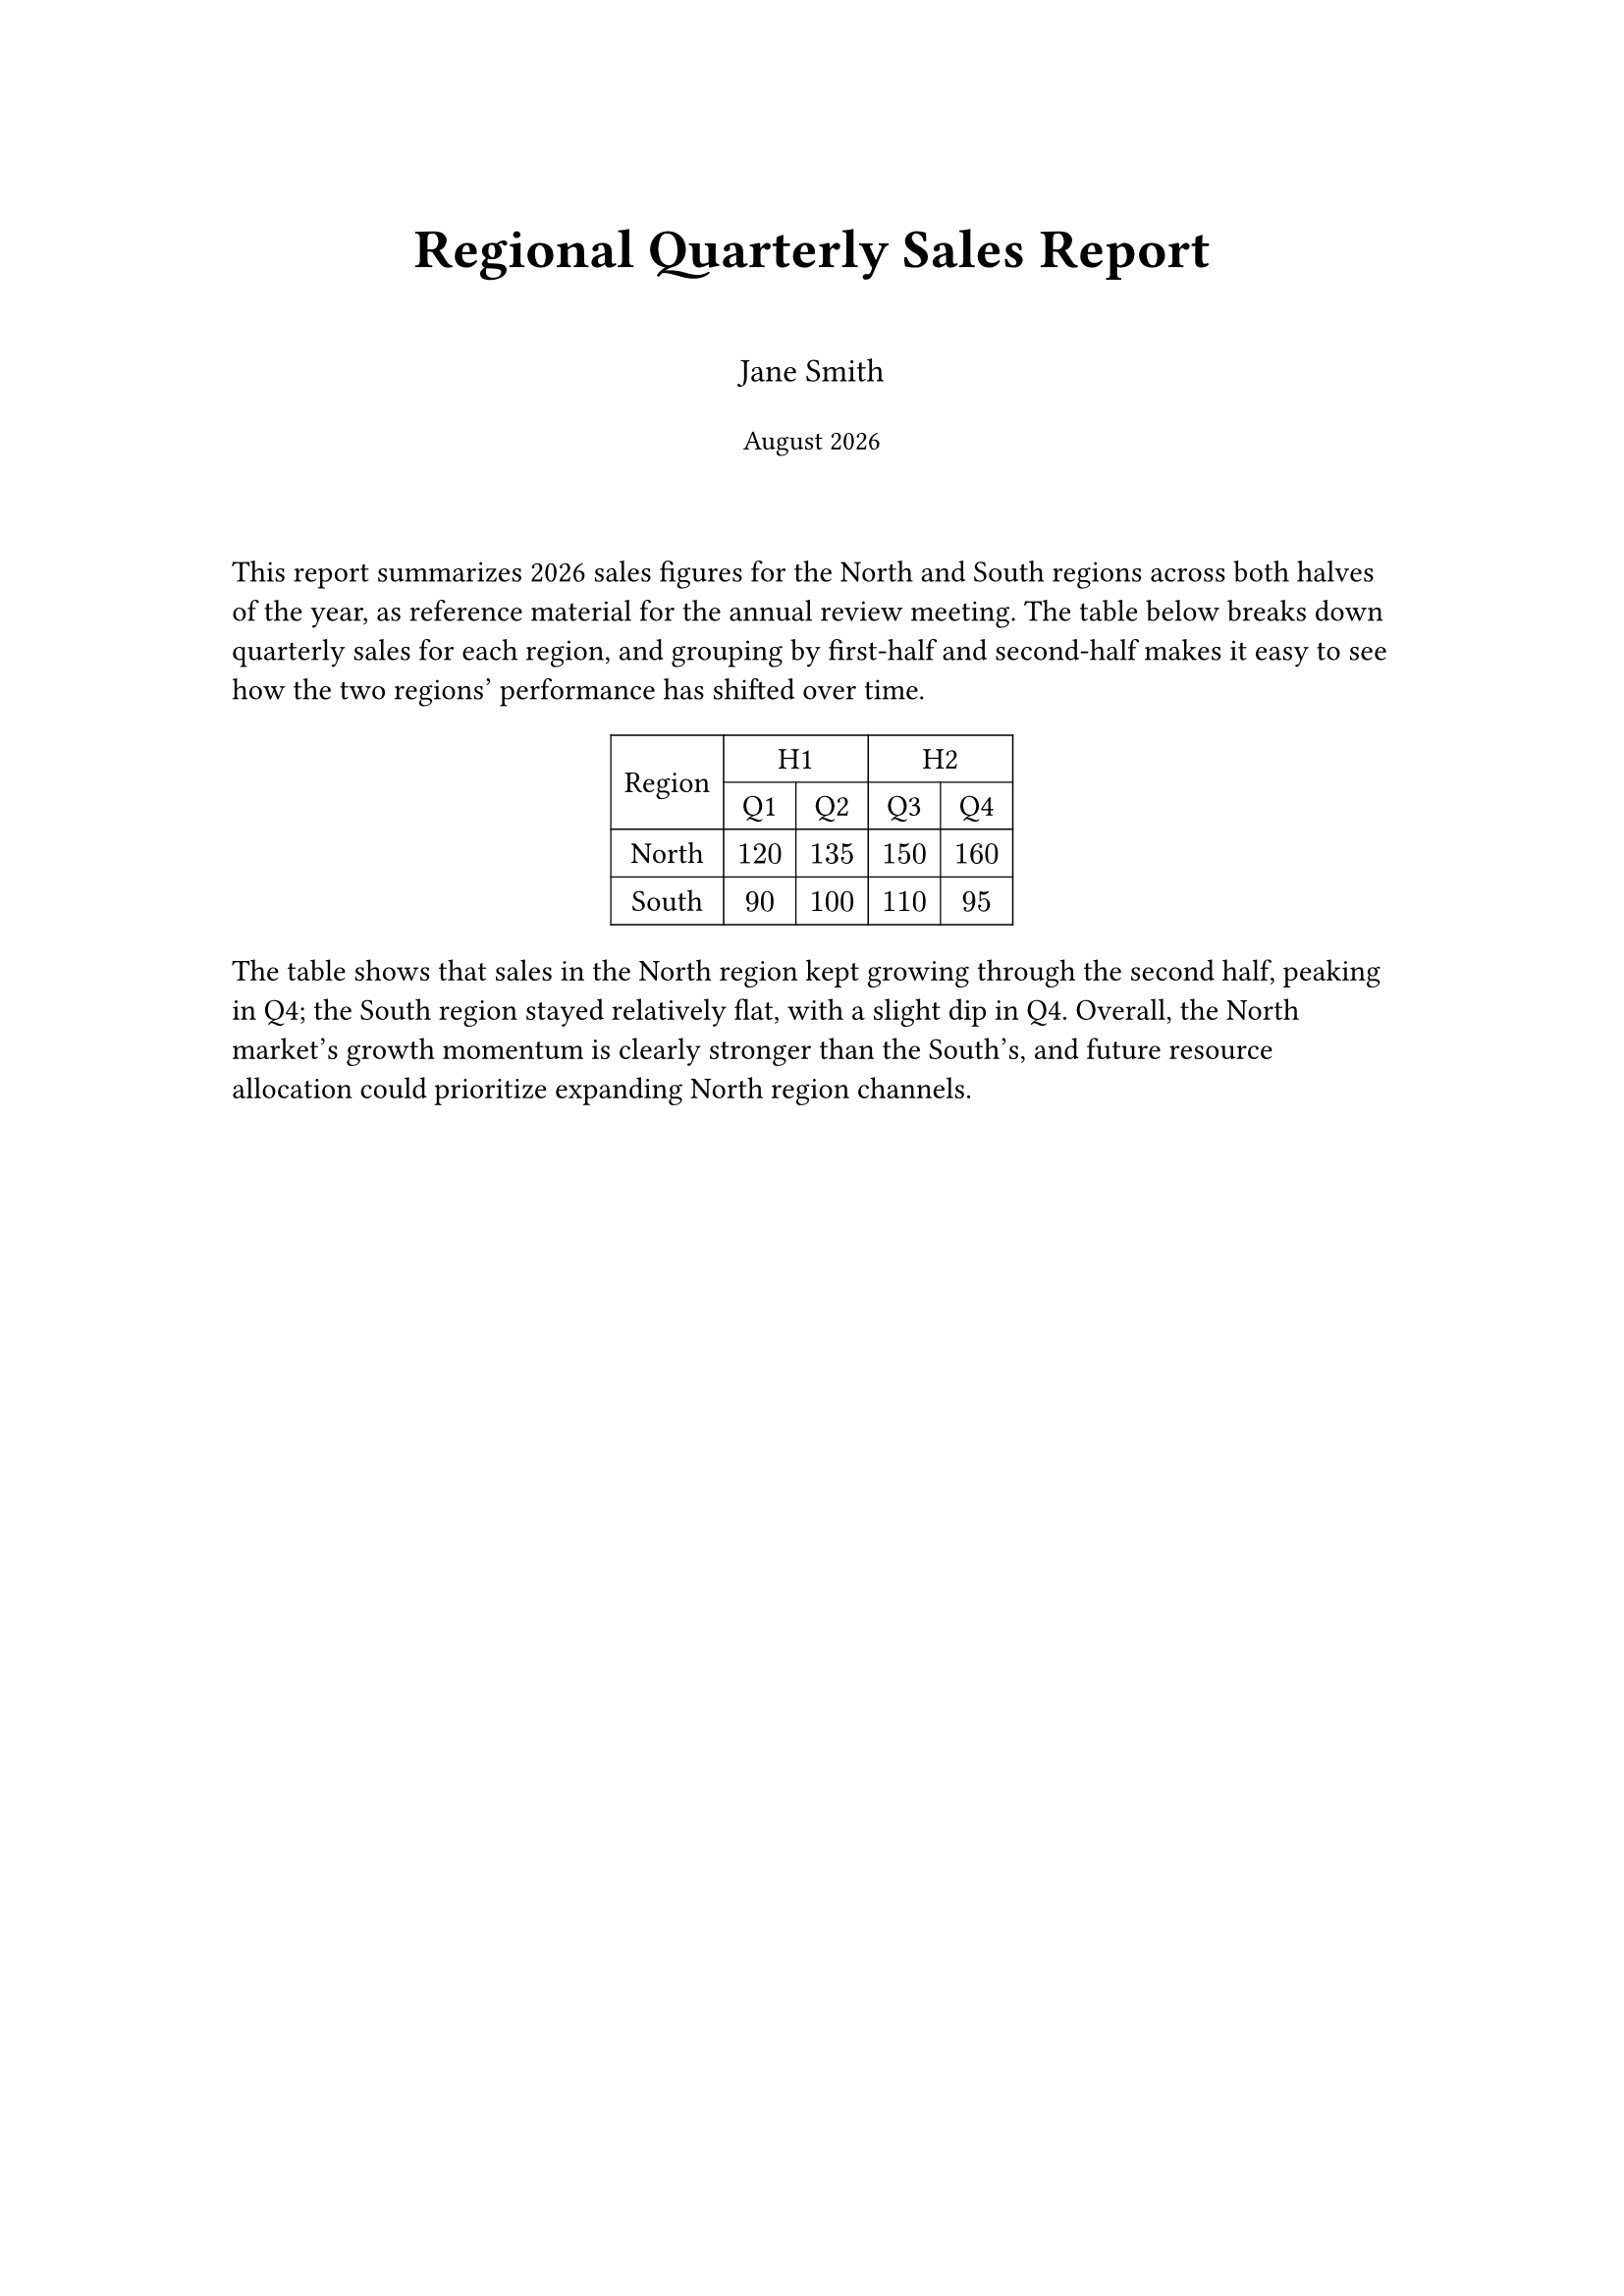
Combining both kinds of merging is how you build the common multi-level header:
Summary
This post started with the basic syntax of the table function, covering how columns sets column widths and table.header marks a header; moved on to cell styling, looking at how align, inset, fill, and stroke can be scoped at the whole-document, single-table, and per-cell levels; then covered the three-line table so common in academic writing, hand-built with table.hline, along with a more realistic regression-table example; and finished with how colspan and rowspan merge cells into multi-level headers.
The next post moves on to the bit of math typesetting only briefly touched on so far, looking at how Typst handles inline and block math.
See you next time~
1.fris short for fraction, meaning a fractional unit: after subtracting every column with a fixed width (auto, a length, or a percentage), whatever space is left gets split proportionally by each column’sfrvalue — for example(1fr, 2fr)splits the remaining space 1:2. ↩
2. For the origin of the three-line table style and the booktabs package’s design principles, see Better LaTeX Tables with Booktabs. ↩
3. The original layout for the regression-table example is adapted from Regression table alignment problem - TeX Stack Exchange. ↩